REPORT
Eviction Alert System
In 2015, 24 different families living at 2 Emery Lane in San Francisco received eviction notices. Fortunately, the residents were more than just neighbors - they were part of a community. So, they were able to organize a protest with the assistance of local community-based organizations.
After hearing of the tenant protest, Mayor Lee stepped in to ask the landlord to withdraw the evictions. The landlord agreed to withdraw most of the evictions.
The experience of Emery Lane led us to wonder: Could there be other Emery Lanes? And if there were, how would we know?
Background: The City regulates rents and evictions for certain housing units
In San Francisco, we have a Rent Ordinance that applies to housing built before June 14, 1979, that both:
- Protects tenants from excessive rent increases and
- Requires landlords to have a “just cause” reason as the dominant motive when pursuing an eviction
This policy has rules for when landlords can lawfully evict tenants. These rules fall into two types: “no fault” evictions and “fault” evictions, where the tenant has committed an act that serves as a just cause for eviction.
For example, a no-fault eviction may involve an owner move-in or a capital improvement eviction. A fault eviction could involve a breach of lease, non-payment of rent, nuisance etc.
Service Question: Can timely review of eviction notice filings flag potentially problematic evictions?
Our Rent Ordinance requires landlords to file a copy of the eviction notice with the Rent Board for certain kinds of evictions. This provides a dataset of eviction notices going back to 1989.
Caveat on eviction notices: While these eviction notices are an indicator of some evictions, they may not result in an actual eviction, nor do they capture all residential evictions. The tenant may respond to the notice and successfully resolve the eviction matter. In addition, not all properties or types of evictions face this filing requirement. Plus, the extent of evictions through informal and unlawful means is unknown, (e.g., landlord intimidation, improper eviction actions that lead to tenant failing to exercise her/his tenant rights, etc.).
Our eviction notices data shows that the volume of notices correlates with economic booms and busts. While the vast majority of landlords work in ethical and lawful ways, unscrupulous landlords and real estate speculators may use multiple tactics to displace long-term tenants in order to reset rents to market rate or to convert the rental unit to a condo.
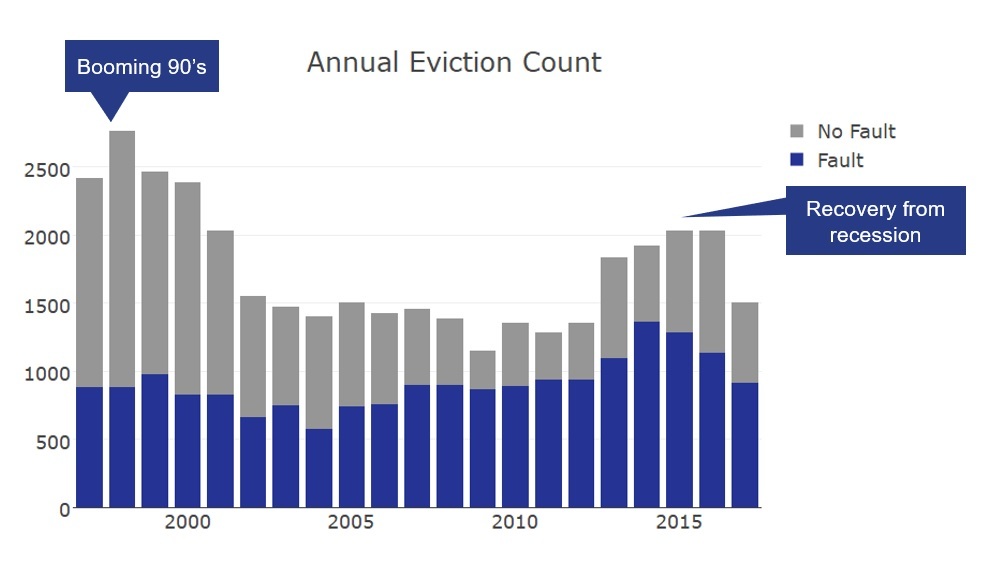
“No fault’ and “fault” eviction notices mirror economic trends.
Tenant displacement due to eviction contributes to homelessness, housing unaffordability, and other complex socioeconomic problems in the City.
While most landlords do not evict for financial gain, we wanted to see if we could use data to identify eviction patterns that fell outside the norm in order to identify potential bad actors.
Analytics: Two metrics show a small % of owners and buildings have abnormal eviction notice patterns
DataScienceSF developed two novel methods to identify abnormal eviction patterns:
- Repeat evictions. This flags owners who file eviction notices repeatedly over time. Specifically, it flags owners who evict an annual average of 15% or more of their housing units regardless of location. This metric helps identify owners who may be repeatedly evicting units across multiple years and properties.
- Mass evictions. This flags buildings where multiple tenants are being evicted within a short time frame. Specifically, it flags buildings where at least 11% of the units in the building are being evicted within a 180-day period. This metric helps identify other buildings like 2 Emery Lane.
These two methods revealed the same pattern: a small number of owners and buildings with high rates of repeat and mass evictions, respectively.
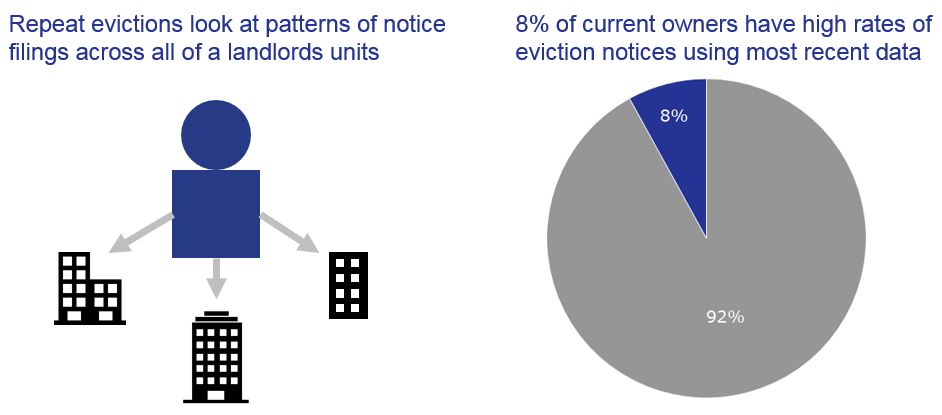
The repeat eviction pattern looks back over several years to identify landlords that file eviction notices at regular intervals across all of their units. This pattern shows that a small percent of current owners who have filed eviction notices have high rates of evictions.
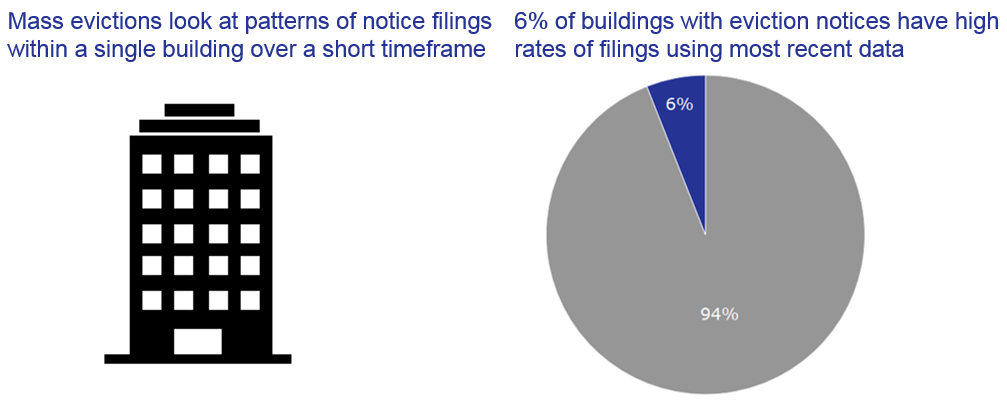
The mass eviction pattern looks within a building over a short timeframe to identify buildings with a large portion of eviction notices filed. This pattern shows that a small percent of buildings issue a large number of eviction notices within a short time period.
Implementation: Alert system flags outliers weekly
Our alert system runs the model and flags outliers on a weekly basis using fresh data. The Mayor’s Office of Housing and Community Development, through a nonprofit consultant, takes the flagged notices and manually reviews their paper files at the Rent Board. They use a scoring rubric to identify false positives and potential bad actors.
MOHCD then deploys community-based organizations that provide tenant counseling, tenant education and outreach, and tenant organizing to these properties to engage other tenants in the building who may be at risk. MOHCD is also using the model to track and validate long-term patterns of misbehavior for more systematic interventions.
This supplements the City’s current eviction prevention services by adding proactive outreach to what has traditionally been a service based on self-referral.
Client Details:
Client Team
- Brian Cheu, Directory of Community Development, MOHCD
- Hugo Ramirez, Senior Community Development Program Specialist, MOHCD