Extreme Heat in San Francisco
San Francisco’s climate is changing. Extreme heat events are becoming more frequent and more intense. While San Francisco's temperatures do not regularly get as hot as other parts of the state or country, San Francisco is particularly vulnerable to extreme heat events when they do occur. According to an analysis of a 2006 California heat wave, emergency department visits for heat-related causes increased the most in the Bay Area Central Coast region.1 There is evidence that San Francisco's emergency department visits, hospitalizations, and mortality begins to increase around 85F with health impacts rising as temperature increases.2
Because San Francisco was a temperate city with a cool coastal climate, our bodies and our buildings are largely un-adapted for extreme temperatures. San Francisco has the lowest rate of air conditioning ownership in the country.3
In San Francisco, extreme heat functions as an “invisible” hazard. The health impacts of extreme heat largely happen indoors — and vulnerability to extreme heat may vary from home to home, person to person, community to community, based on many intertwined physiological, social, and economic factors.
Climate Projections
What is an extreme heat event?
A San Francisco extreme heat event is any temperature in the top two percent of all San Francisco temperatures between the years 1961- 1990. By this standard, in San Francisco an extreme heat event is officially any day over 85°F.
How often has San Francisco historically had extreme heat events?
Between 1960 and 1990, San Francisco has averaged three or four extreme heat events per year. The warmest years had upwards of 10 extreme heat days.
How many extreme heat events are expected in San Francisco?
- Mid-Century (2035 – 2064) Based on the Cal-Adapt High Emissions Scenario projections, between 2035 and 2064, San Francisco is expected to have an average of 7 extreme heat events. Particularly hot years would have a maximum of 24 extreme heat events.4
- Late-Century (2070 – 2099) Based on the Cal-Adapt High Emissions Scenario projections, between 2070 – 2099, San Francisco is expected to have an average of 15 extreme heat events. Particularly hot years would have a maximum of 51 extreme heat events.
All Extreme Heat Days (over 85°F)
Based on the Cal-Adapt High (RCP 8.5) modeling scenario.
| Baseline Modeled Days per Year (1961 – 1990) | Mid-Century Projected Days per Year (2035 – 2064) | End-Century Projected Days per Year (2070 – 2099) |
|---|---|---|
Average 3 | Average 7 | Average 15 |
Maximum 10 | Maximum 24 | Maximum 51 |
How often does it get really hot in San Francisco?
Even though San Franciscans begin experiencing health impacts of extreme heat happen at 85F, as the temperature increases, so do emergency department visits, hospitalizations, and deaths. Between 1923 and 2023, San Francisco’s temperatures reached 95F only 67 times—an average of less than one day per year.5
How many 95F days are expected in San Francisco?
- Mid-Century (2035 – 2064): Based on the Cal-Adapt High Emissions Scenario projections, San Francisco is expected to have an average of one day over 95F per year. Particularly hot years would have a maximum of seven days over 95F.
- Late-Century (2070 – 2099): Based on the Cal-Adapt High Emissions Scenario projections, between 2070 – 2099, San Francisco is expected to have an average of two day over 95F per year. Particularly hot years would have a maximum of ten days over 95F.
All Extreme Heat Days (over 95°F)
Based on the Cal-Adapt High (RCP 8.5) modeling scenario.
| Baseline Modeled Days per Year (1961 – 1990) | Mid-Century Projected Days per Year (2035 – 2064) | EndEnd-Century Projected Days per Year (2070 – 2099) |
|---|---|---|
Average 0 | Average 1 | Average 2 |
Maximum 1 | Maximum 7 | Maximum 10 |
Will climate change affect San Francisco's nighttime temperatures too?
Nighttime temperatures are rising faster than daytime temperatures. 6 The combination of high daytime and nighttime temperatures means our bodies and our buildings have little time to cool before temperatures increase again the following day. Evidence suggests that increases in daily minimum temperatures may be more dangerous to human health than increases in daily maximum temperatures.7
How does extreme heat affect air quality?
San Francisco's air quality is likely to worsen as extreme heat events increase in frequency and intensity because heat accelerates the development of ground-level ozone (smog).8
Health Impacts
Is extreme heat a public health threat?
The health impacts of extreme heat are significant. Heat is responsible for more deaths a year than any other weather hazard.9 Nearly 700 Americans die from extreme heat each year.10 Extreme heat has direct health impacts and can exacerbate many underlying health conditions. Analyses that examine the relationship between temperature and deaths, hospitalizations, and emergency department visits often show extreme heat is correlated with more health impacts than those diagnosed as heat-related. The health impacts of extreme heat are likely underreported.11
What are the direct health impacts of extreme heat?
- Heat Stroke
- Heat Exhaustion
- Heat Cramps
- Dehydration
What underlying health conditions can be exacerbated by extreme heat?
- Cardiovascular Disease
- Respiratory Illness and COPD
- Diabetes and Renal Failure:
- Mental and Behavioral Health
What are indirect impacts of extreme heat events?
- Falls (out of open windows)
- Drownings
- Health Impacts of Poor Air Quality
- Health Impacts of Power Disruption
- Medicines may become less effective or dangerous in extreme temperatures. These medicines include psychotropics, medications for Parkinson's disease, tranquilizers, and diuretics.
How can I prepare for the health impacts of extreme heat?
- Connect to the San Francisco emergency preparedness portal, SF72.
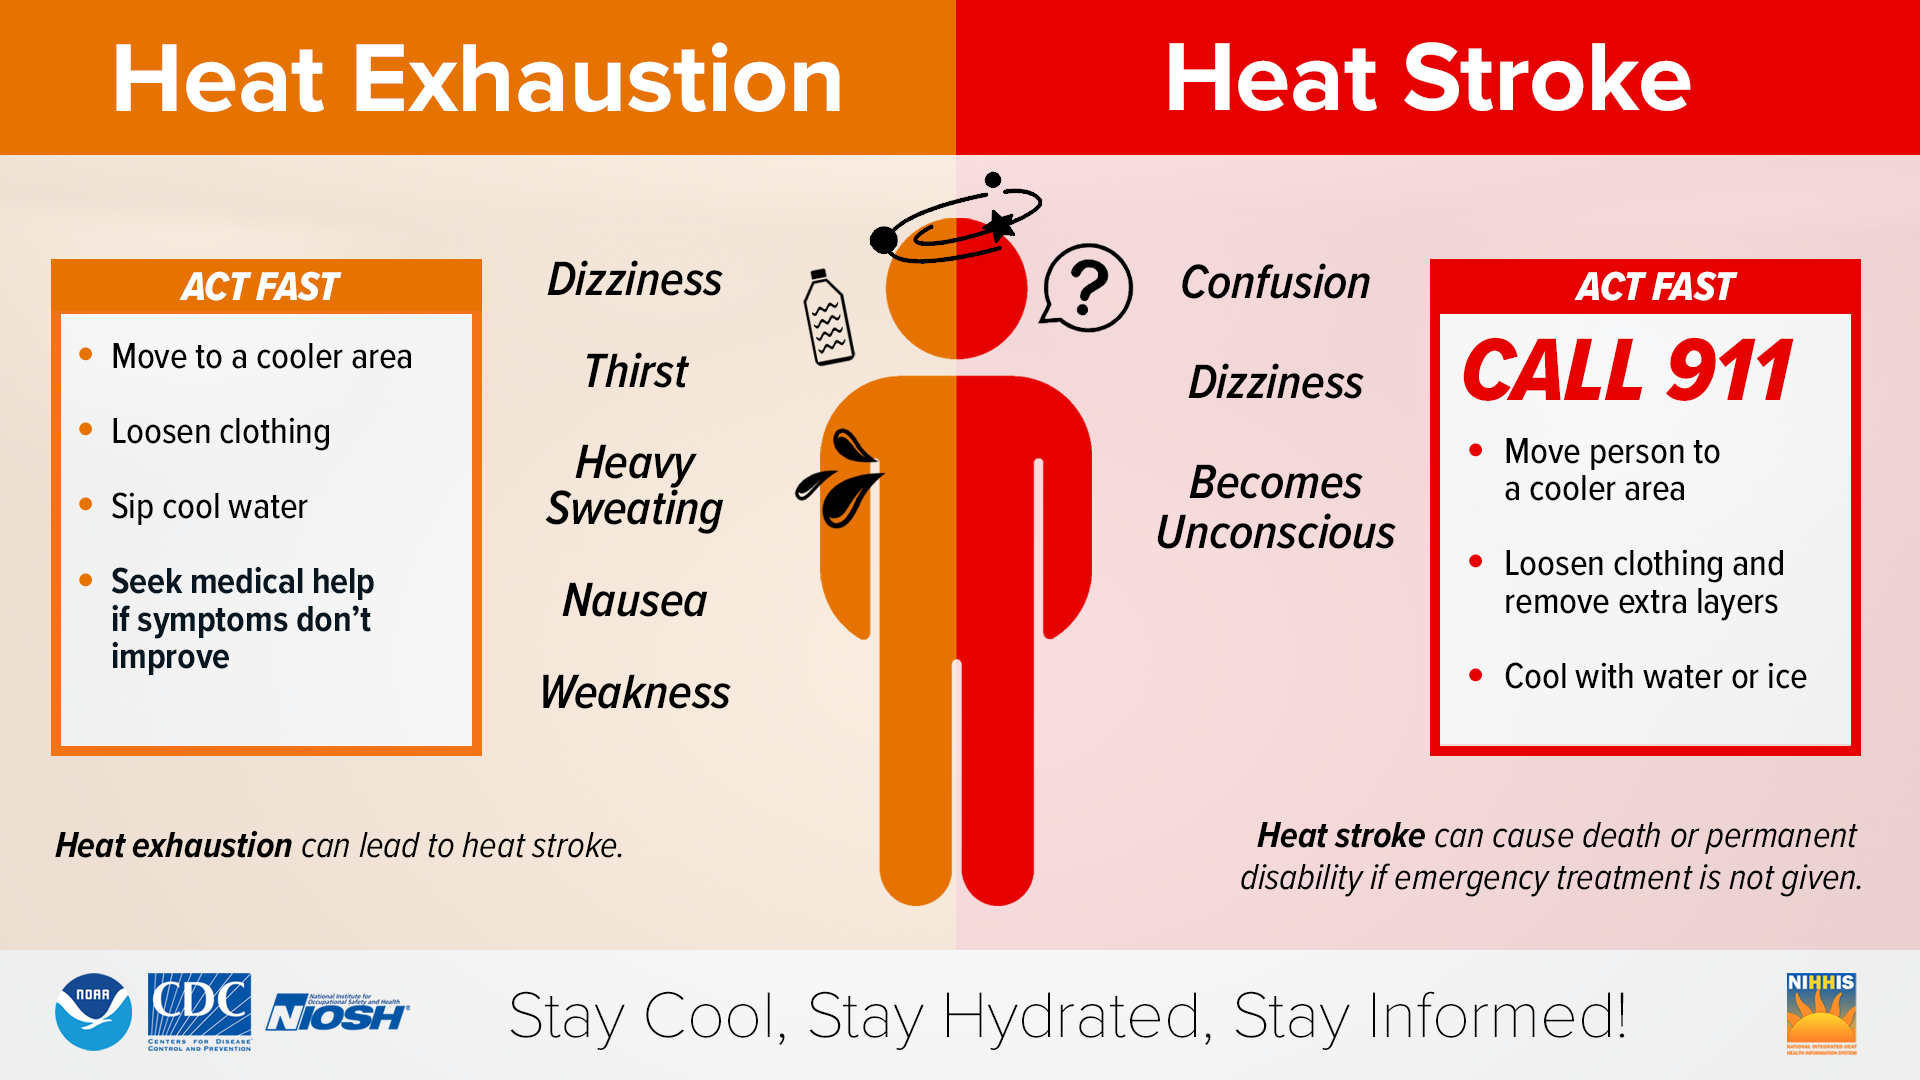
- Understand the difference between heat exhaustion and heat stroke and when to seek medical help.
- Learn about safe medicine storage and medicines that may be less effective or dangerous in extreme temperatures.
- Learn about frequently asked questions (FAQ) about extreme heat.
Drivers of Health Impacts
While everyone is vulnerable to the health impacts of extreme heat, not everyone will be impacted evenly. The communities that suffer the most are the ones who already currently carry the heaviest health burden. This inequitable distribution of health impacts is referred to as the climate gap. Certain communities will be particularly impacted based on exposure, sensitivity, and adaptive capacity.
Below we define these three categories. Please check out our Climate Change and Equity page for more information on the drivers of health impacts.
Exposure
Exposure refers to a person's proximity (or exposure) to extreme heat. Exposure can vary from neighborhood to neighborhood, community to community, and household to household. Things that can modify exposure include:
- Access to air conditioning or cooling.
- Being unhoused or marginally housed.
- Living in a neighborhood that gets hotter than surrounding neighborhoods
- Living in neighborhoods without tree coverage
- Living in neighborhoods with a lot of pavement or other impervious surfaces.
Sensitivity
Sensitivity refers to a person's physiological reaction to extreme heat. Two people may be equally exposed to extreme temperatures, but one person may be more sensitive to that exposure. Sensitivity varies from person to person. People that are particularly sensitive to extreme heat include:
- Older adults
- Children
- People with pre-existing health conditions such as cardiovascular illnesses, asthma, and diabetes.
- People who take medicine that either becomes ineffective or dangerous during extreme heat events.
Adaptive Capacity
Adaptive capacity refers to the ability of a person to prepare for or respond to extreme heat. Two people may be equally exposed and equally sensitive, but one person may be more resilient because they have access to political, economic, or social resources. Adaptive capacity can be influenced by:
- Race and ethnicity
- Social isolation
- Income
- Disability
Extreme Heat Vulnerability Assessment (2019)
The San Francisco Extreme Heat Vulnerability Assessment used exposure, sensitivity, and adaptive capacity indicators to project the distribution of heat-related health impacts in San Francisco.

Back to Climate and Health Home Page
Citations
1. Knowlton, K., Rotkin-Ellman, M., King, G., Margolis, H., Smith, D., Solomon, G., Trent, R., and English, P., The 2006 California Heat Wave: Impacts of Hospitalizations and Emergency Department Visits. Environmental Health Perspectives. August 22, 2008. Retrieved from: https://pubmed.ncbi.nlm.nih.gov/19165388/
2. Gasparrini, A., Guo, Y., Hashizume, M., Kinney, P., Petkova, E., Lavigne, E., Zanobetti, A., Schwartz, J., Tobias, A., Leone, M., Tong, S., Honda, Y., Kim, H., and Armstrong, B. Temporal Variation in Heat-Mortality Associations: A Multicounty Study. Environmental Health Perspectives. November, 2015. Retrieved from: https://pubmed.ncbi.nlm.nih.gov/25933359/
3. Moore, S. San Francisco is now the least air-conditioned city in the country. San Francisco Chronicle. January 2, 2023. Retrieved from: https://www.sfgate.com/local/article/san-francisco-lacks-air-conditioning-17685873.php
4. Cal-Adapt. (2018). [Number of Extreme Heat Days for San Francisco County, RCP 8.5, Global Climate Models HadGEM2-ES, CNRM-CM5, CanESM2, MIROC5].
5. National Oceanic and Atmospheric Administration (NOAA) National Centers for Environmental Information, Climate Data Online (CDO). Daily Summaries San Francisco 01/01/1923 - 01/01/2023. Retrieved from: https://www.ncdc.noaa.gov/cdo-web/search
6. Reidmiller, D., Avery C., Easterling, D., Kunkel, K., Lewis, K, Maycock, T., and Stewart, B. Impacts, Risks, and Adaptation in the United States: Fourth National Climate Assessment, Volume II. U.S. Global Change Research Program. 2018. Retrieved from: https://science2017.globalchange.gov/chapter/6/
7. He, C., Kim, H., Hashizume, M., Lee, W., Honda, Y., Kim, S., Kinney, P., Schneider, A., Zhang, Y., Zhu, Y., Zhou, L., Chen, R., Kan, H. The effects of night-time warming on mortality burden under future climate change scenarios: a modeling study. Lancet Planetary Health Volume 6, Issue 8. August 2022. Retrieved from: https://www.sciencedirect.com/science/article/pii/S2542519622001395
8. Ground-level Ozone Basics. United States Environmental Protection Agency (EPA). Retrieved from: https://www.epa.gov/ground-level-ozone-pollution/ground-level-ozone-basics
9. Heat-related mortality and morbidity. California Office of Environmental Health Hazard Assessment (OEHHA). February 11, 2019. Retrieved from: https://oehha.ca.gov/epic/impacts-biological-systems/heat-related-mortality-and-morbidity
10. Vaidyanathan A., Malilay J., Schramm P., Saha S. Heat-Related Deaths — United States, 2004–2018. MMWR Morb Mortal Wkly Rep. 2020. Retrieved from: https://www.cdc.gov/mmwr/volumes/69/wr/mm6924a1.htm
11. Petkova, E., Morita, H., Kinney, P. Health impacts of heat in a changing climate: how can emerging science inform adaptation planning? Curr Epidemiology Rep. April 5, 2014. Retrieved from: https://www.ncbi.nlm.nih.gov/pmc/articles/PMC4240518/