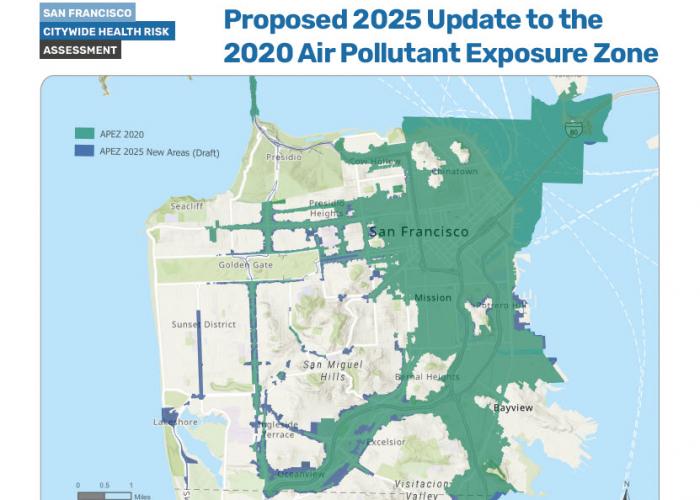
The map represents parcels in San Francisco that have PM 2.5 levels modeled at 9ug/m3 or greater, contributing from roadway traffic, permitted stationary sources, and maritime sources. Please see the summary of updates and modeling for more information.
Public comments can be emailed to Jennifer.Callewaert@sfdph.org by November 25, 2024.
