
Key findings from the annual report
This report provides an overview of the current condition of San Francisco's streets and sidewalks.

About the program
The Street and Sidewalk Standards Program is an annual assessment of the cleanliness and appearance of public streets and sidewalks. The feature scores presented in this report, in percentage (%), tell us the likelihood (odds) of anyone experiencing specific ratings when randomly visiting any street segment in 2022.
We all play a part in maintaining San Francisco’s street and sidewalk cleanliness.
Back to top
What and where we evaluated
The evaluation team assessed 3,000+ sampled street and sidewalk segments by reviewing 14 specific features below. This new set of features is evaluated differently from past reports, using the new version of the evaluation standards.
Click here to view the updated standards.
Evaluation features:
Streets only:
- Street litter
Sidewalks only:
- Sidewalk litter
- Trash receptacles
- Sidewalk clearance
- Sidewalk pavement condition
Streets and sidewalks together:
- Illegal dumping
- Hazards (broken glass, feces, syringes, used/open condoms, dead animals, odors)
- Graffiti
- Transit shelters
The team conducted evaluations across San Francisco geographically in two surveys: The Core Citywide Survey and the Key Commercial Areas Survey.
Core Citywide Survey
The Core Citywide Survey includes 957 randomly selected street segments, comprised of 817 evaluations in residential areas and 140 evaluations in commercial areas. This sufficiently sized sample represents all the streets and sidewalks across the entire City and County San Francisco. However, due to insufficient sample sizes at the neighborhood-level in the Core Citywide survey, neighborhood-level results are not reported here.
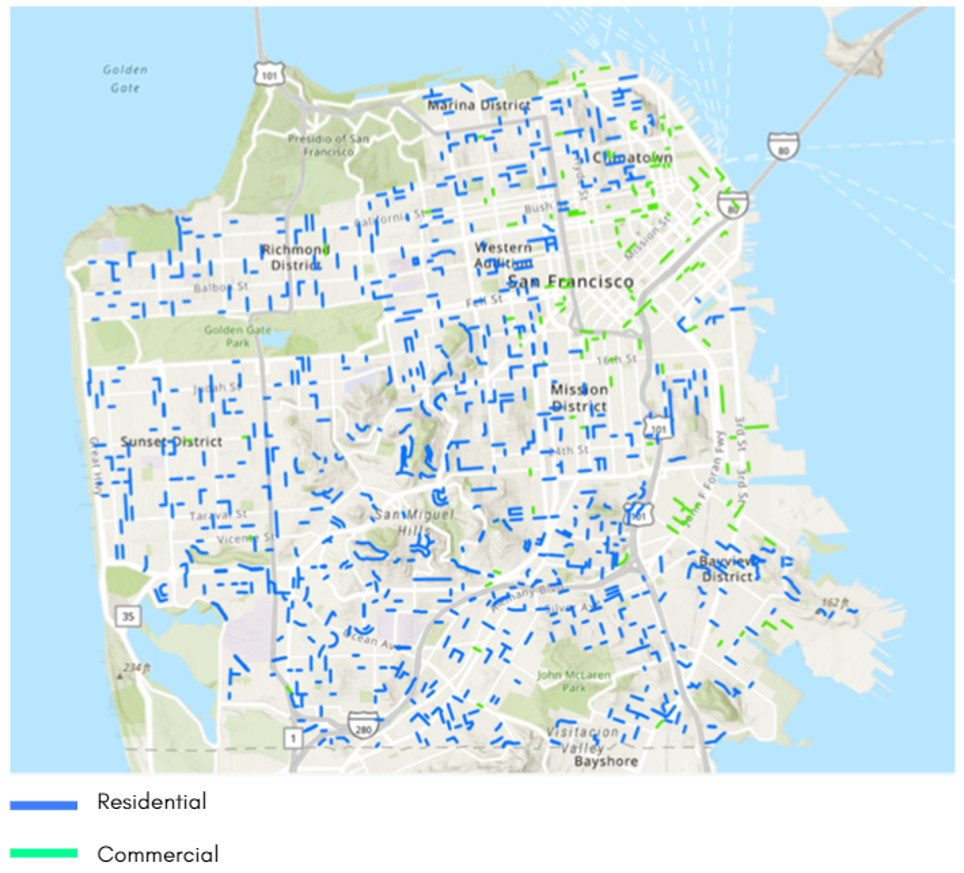
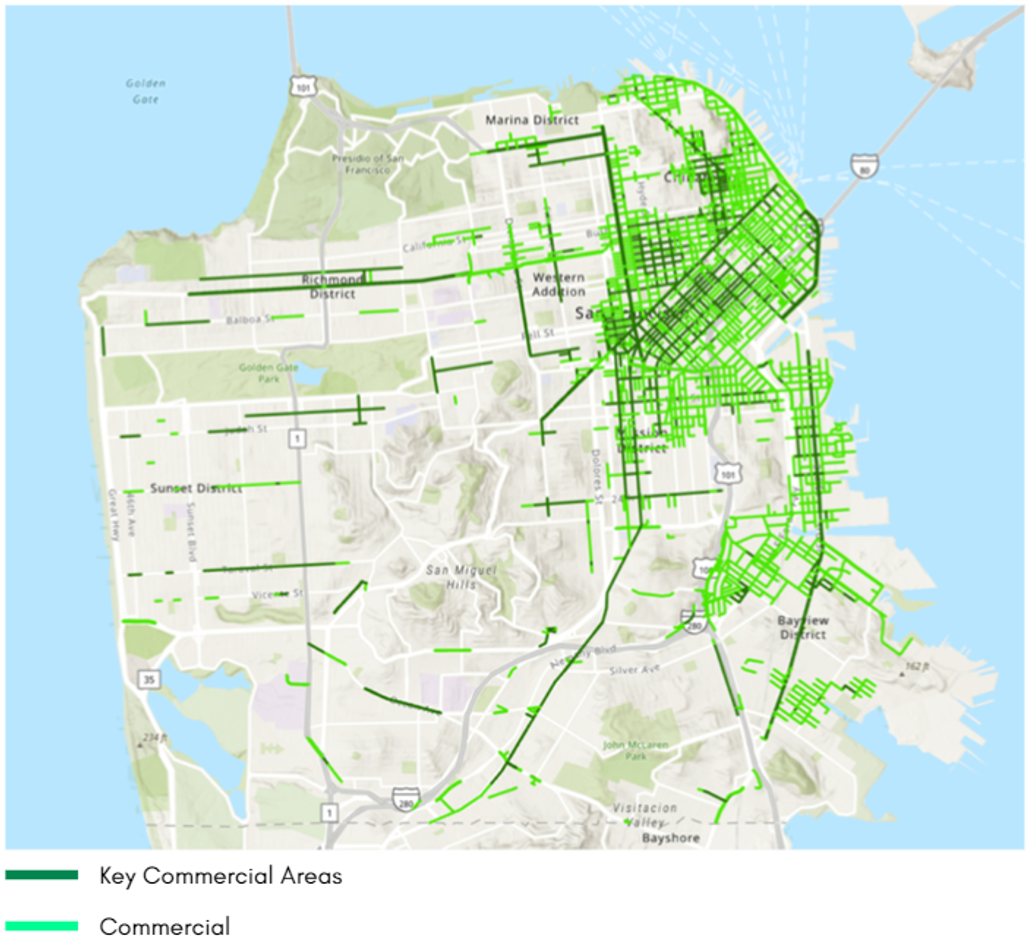
Key Commercial Areas Survey
The Key Commercial Areas Survey consists of routes selected from high traffic commercial street segments across the City using the historical volume of 311 requests for service within neighborhoods. The Survey focuses on the 769 high-use corridors selected from commercial, industrial, or mixed-use street segments.
Note about neighborhood level analysis:
It should be noted that the neighborhood-level results presented below represent findings in Key Commercial Areas only.
In addition, to account for neighborhoods with small sample sizes we combined some neighborhoods into two new merged neighborhoods. We took this approach to avoid misrepresenting survey findings in neighborhoods where fewer evaluations were conducted.
Back to top
Key findings
Back to topStreets
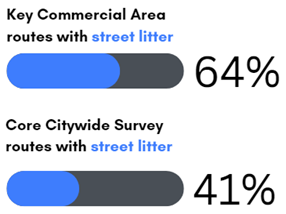
64% of Key Commercial Area evaluations have street litter
The chart below shows the percent of evaluated routes in both the Key Commercial Areas and Core Citywide Survey that street litter was present. 64% of routes in the Key Commercial Areas Survey and 41% of routes in the Core Citywide Survey contained moderate to severe amounts of street litter.
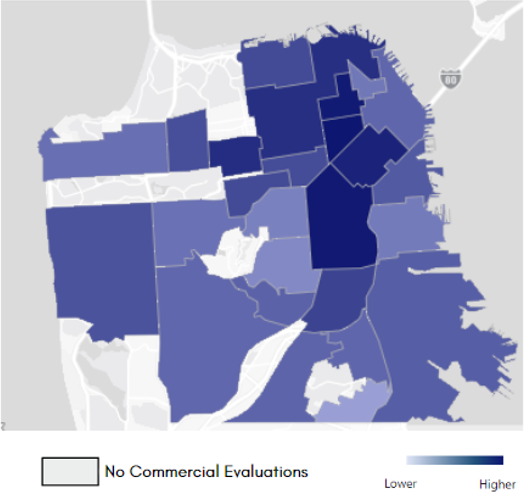
Neighborhood level analysis for Key Commercial Areas
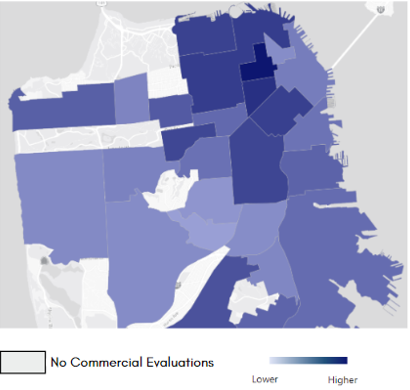
The map below shows neighborhood-level results for street litter, with darker shades of purple representing higher severity levels.
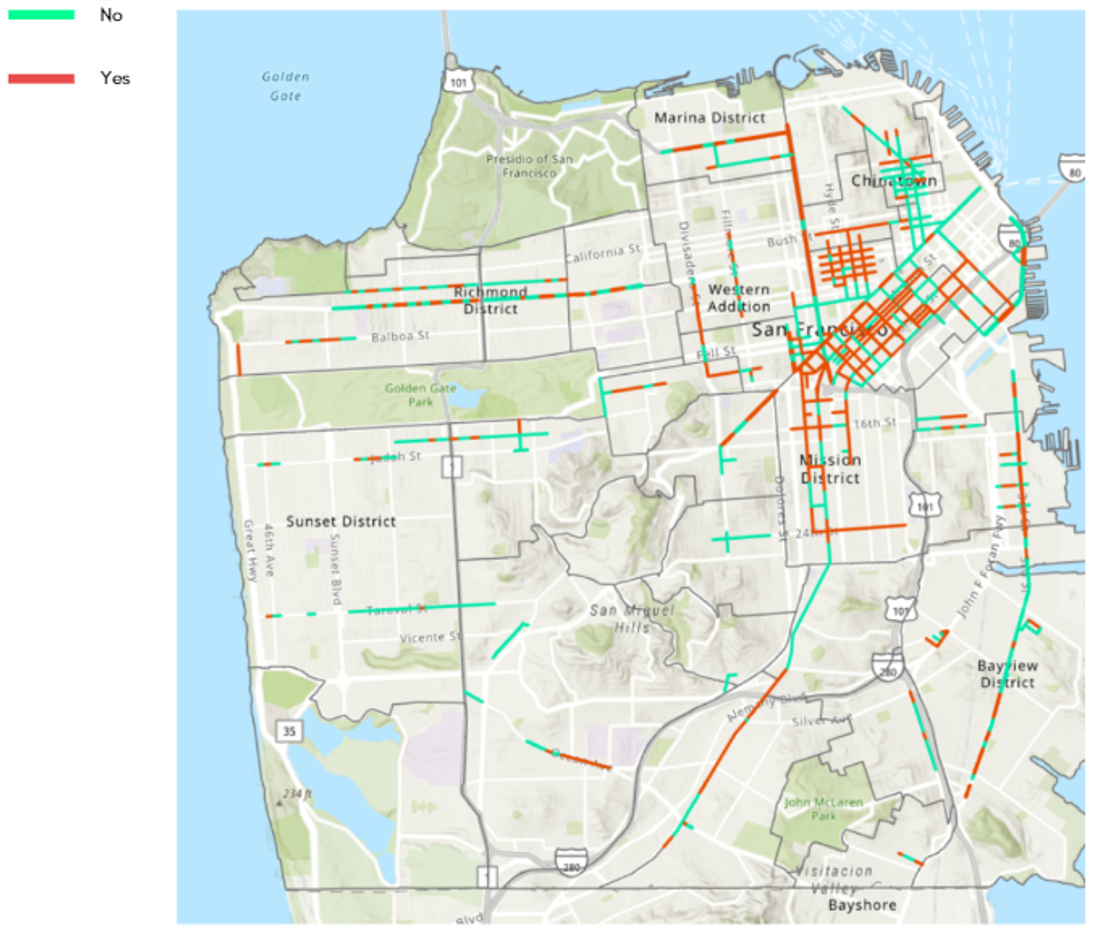
The map below shows the average rating per street segment for street litter.
Sidewalks
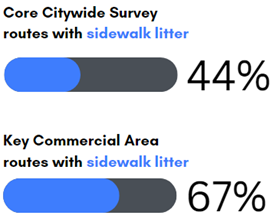
44% of evaluations have sidewalk litter
44% of the sampled sidewalks had moderate to severe levels of sidewalk litter in the Core Citywide Survey. However, there was much more sidewalk litter in Key Commercial Areas at 67%.
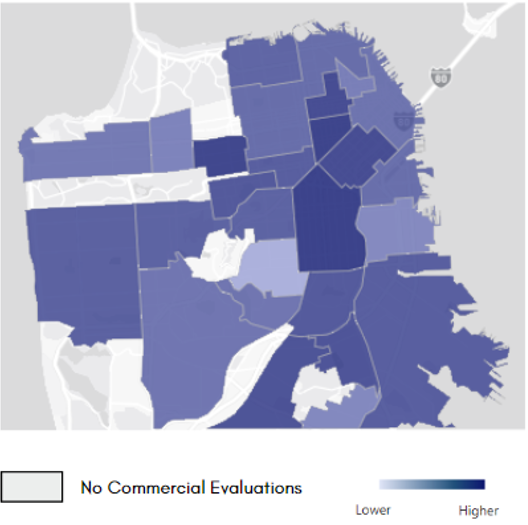
Neighborhood level analysis for Key Commercial Areas
The map below shows neighborhood-level results for sidewalk litter, with darker shades of purple representing higher severity levels.
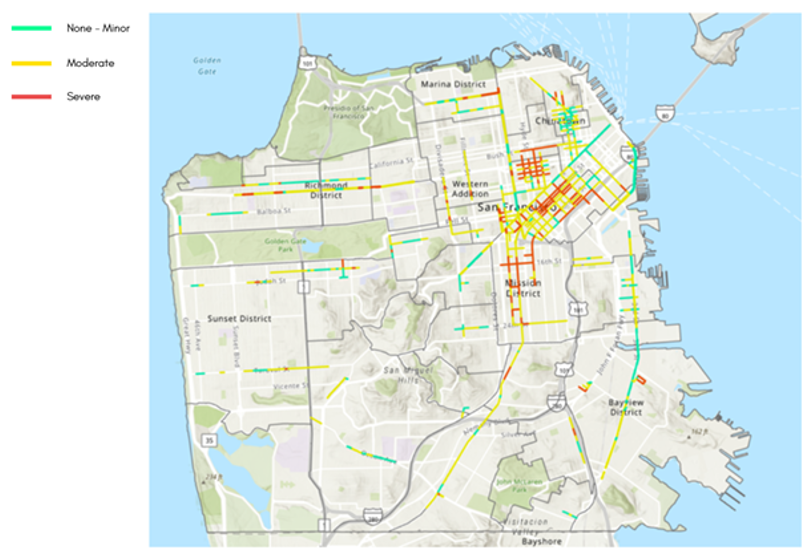
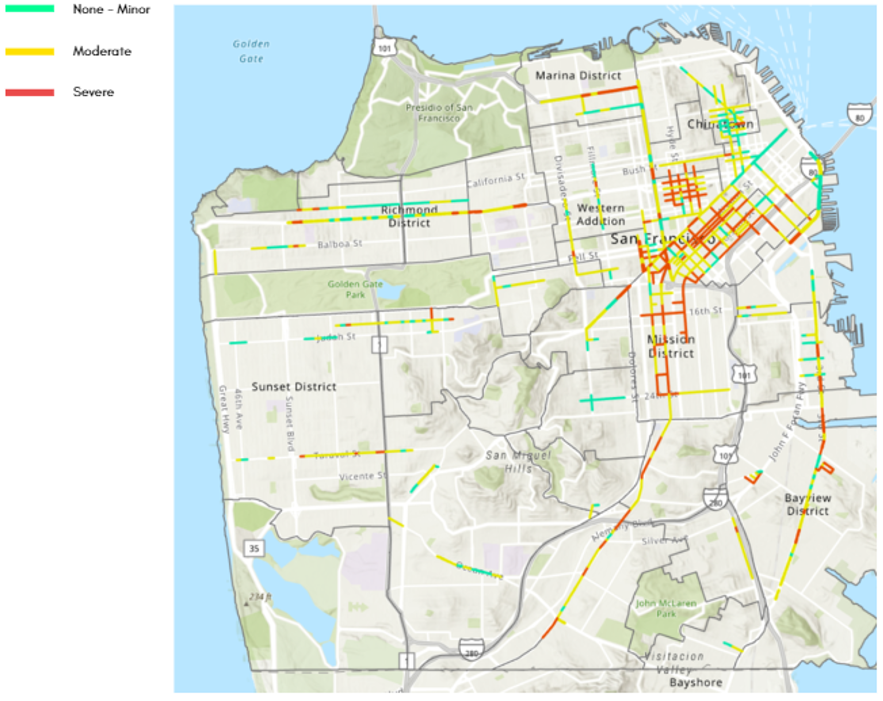
The map below shows the average rating per street segment for sidewalk litter.
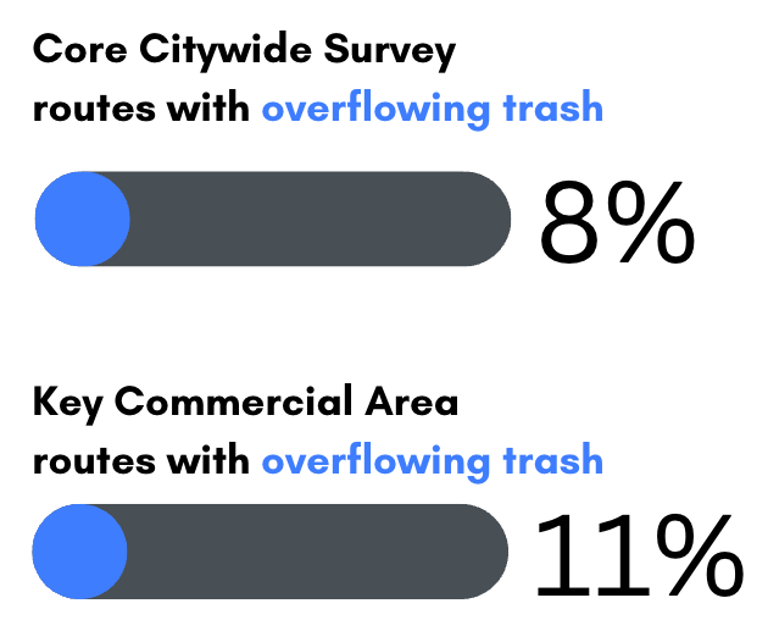
8% of evaluated sidewalks had overflowing trash
Trash receptacles on the sidewalks can be another source of litter, especially if the receptacle is full or overflowing. 8% of evaluations had overflowing trash in the Citywide survey. Similarly, 11% of evaluations in Key Commercial areas reported trash overflowing from receptacles.
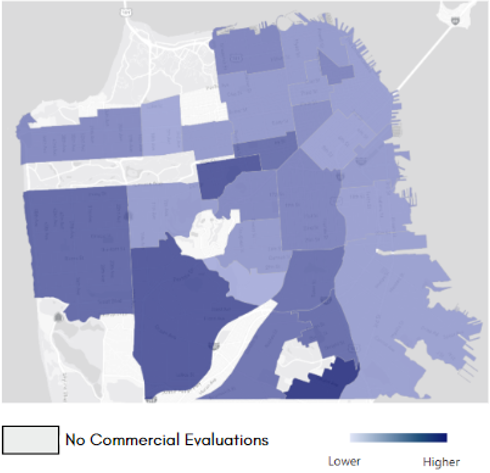
Neighborhood level analysis for Key Commercial Areas
The map below shows neighborhood-level results, with darker shades of purple representing higher occurrences of overflowing trash.
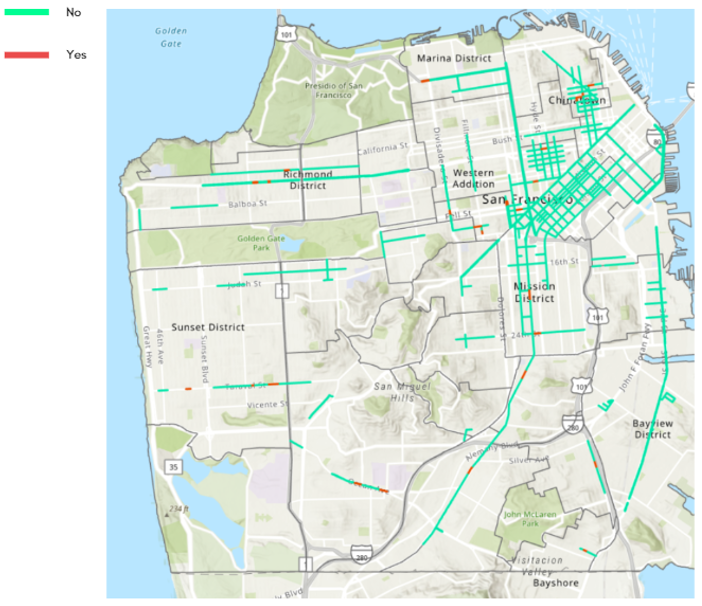
The map below shows the street segments where overflowing trash was observed.
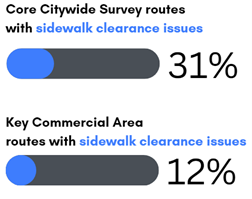
More than 30% of evaluated sidewalks had clearance issues
This category evaluates if larger objects, such as a tree branch, litter, or other bulky items obstructed a sidewalk. In the Core Citywide Survey, 31% of evaluations had clearance issues; in Key Commercial Areas, 12% of busy sidewalks had obstructed pathways.
Neighborhood level analysis for Key Commercial Areas
The map below shows neighborhood-level results, with darker shades of purple representing higher occurrences of sidewalk clearance issues.
The map below shows the street segments where sidewalk clearance issues were observed.
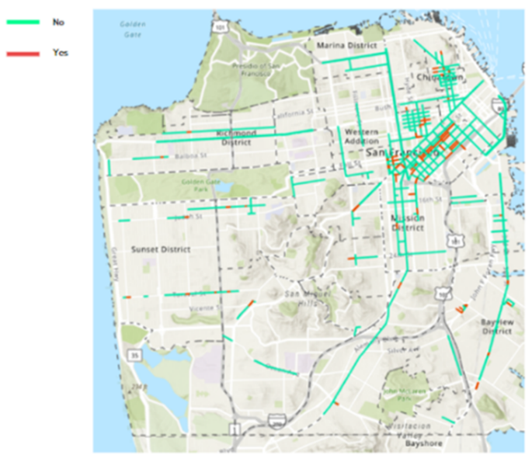
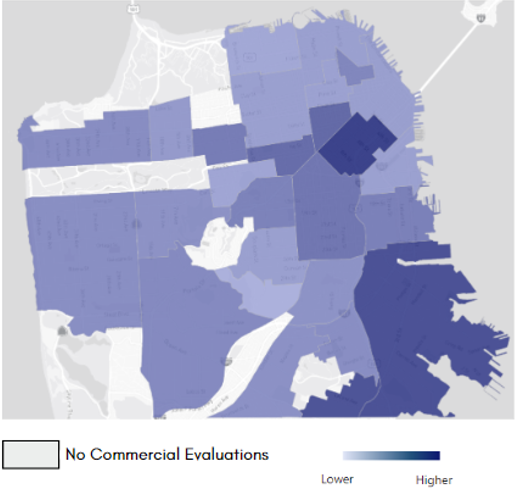
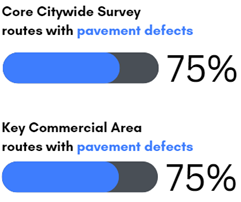
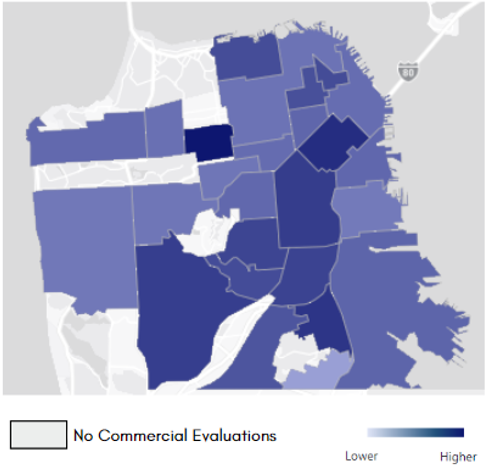
75% of evaluated sidewalks have moderate to severe pavement defects
The surveys examine the condition and quality of the sidewalk pavement, including cracking, breakage, and uneven surfaces. In the core Core Citywide Survey, 75% of observations indicated moderate to severe defects in pavement conditions. The severity of pavement conditions was the same in Key Commercial Areas, with 75% of evaluations indicating moderate to severe pavement defects.
Neighborhood level analysis for Key Commercial Areas
The map below shows neighborhood-level results for sidewalk pavement defects, with darker shades of purple representing higher severity levels.
The map below shows the average rating per street segment for sidewalk pavement condition.
Streets and Sidewalks Together
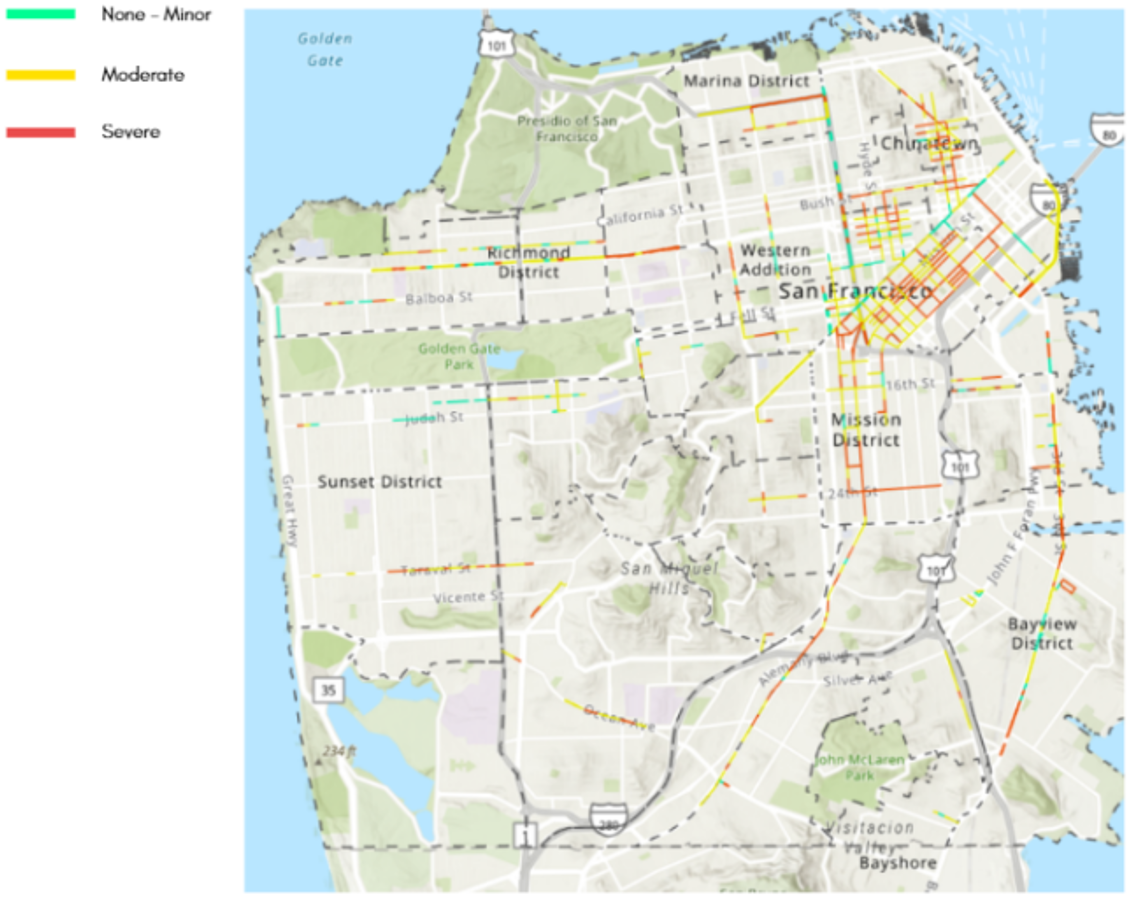
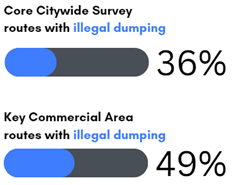
More than 30% of evaluations report illegal dumping
Illegal dumping includes large abandoned items and debris on both the street and sidewalk. 36% of evaluations in the Core Citywide Survey found illegal dumping, and 49% of the evaluations in Key Commercial Areas had illegal dumping present.
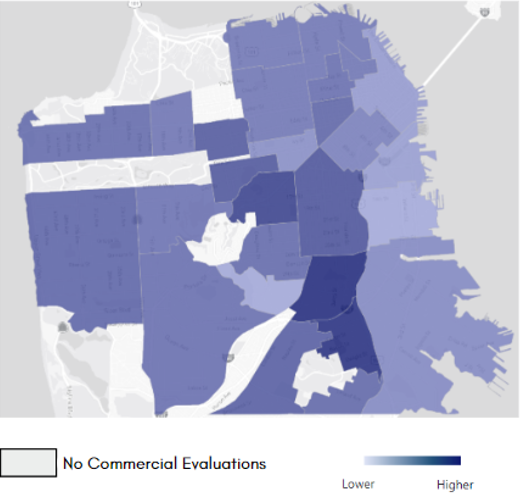
Neighborhood level analysis for Key Commercial Areas
The map below shows neighborhood-level results for illegal dumping, with darker shades of purple representing higher occurrences.
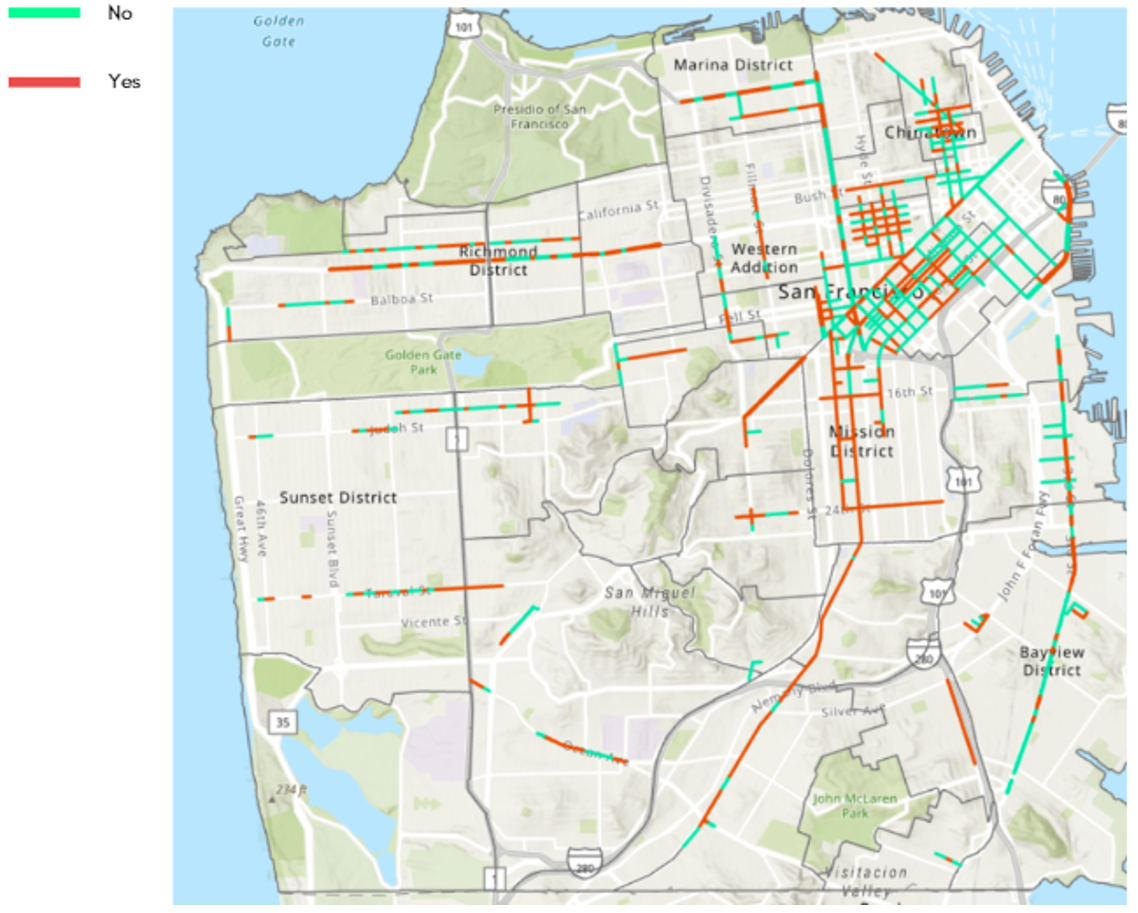
The map below shows the street segments where illegal dumping was observed.
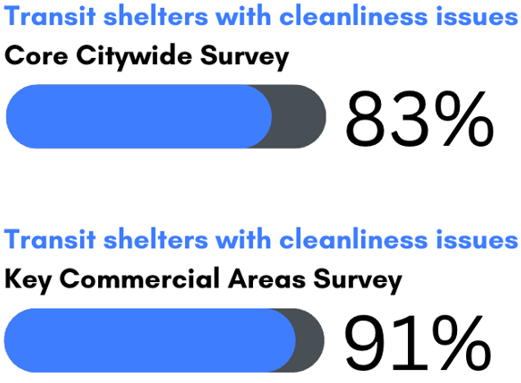
More than 80% of transit shelters on evaluated streets & sidewalks had cleanliness issues
The survey evaluated the physical structure and space within the transit shelter, as well as the area immediately next to the shelter. About 83% of transit shelters in the Core Citywide survey had at least one type of cleanliness issue, such as litter, overflowing trash, or illegal dumping, among other issues. Key Commercial Areas were much more likely to have transit shelters present, and of these, more than 90% had cleanliness issues.
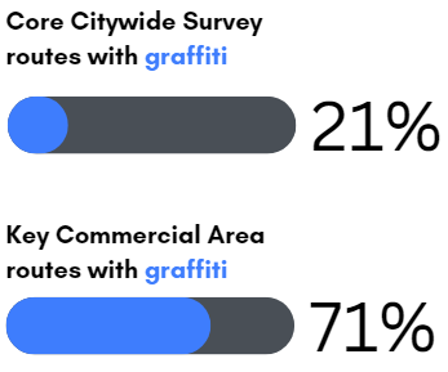
About 20% of evaluated streets & sidewalks have graffiti, but graffiti more common in commercial areas
Graffiti is another important street and sidewalk evaluation feature that includes illicit text, symbols, and images marked on buildings, sidewalks, street pavement, trees, and other stationary objects that are visible to the public. In the Core Citywide Survey, 21% of evaluations found moderate to severe levels of graffiti. In contrast, Key Commercial Areas were far more likely to have moderate to severe graffiti at 71%.
Neighborhood level analysis for Key Commercial Areas
The map below shows neighborhood-level results for graffiti, with darker shades of purple representing higher severity levels.
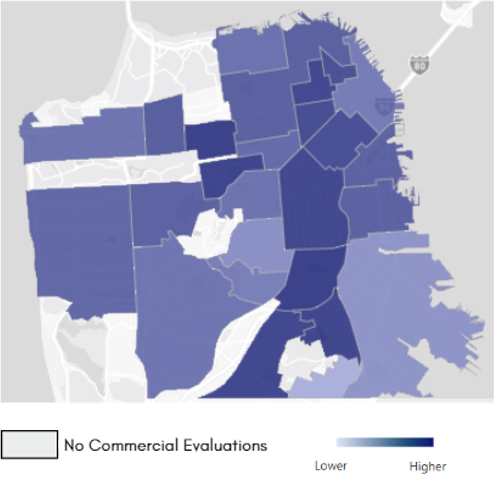
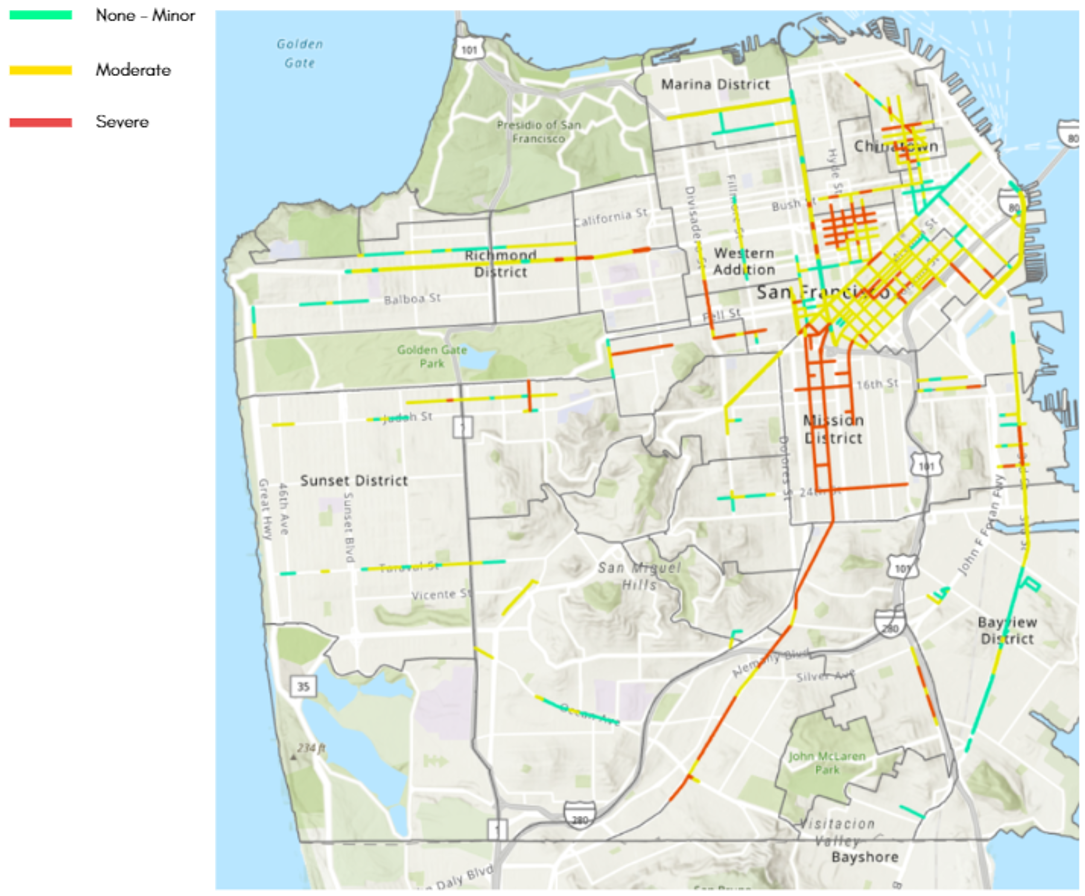
The map below shows the average rating per street segment for graffiti.
Hazards
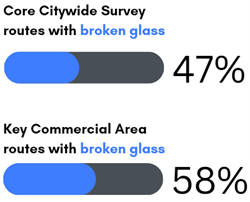
Almost 50% of city streets and sidewalks report broken glass
Broken glass was fairly common in both the Core Citywide Survey (47%), as well as in Key Commercial Areas (58%).
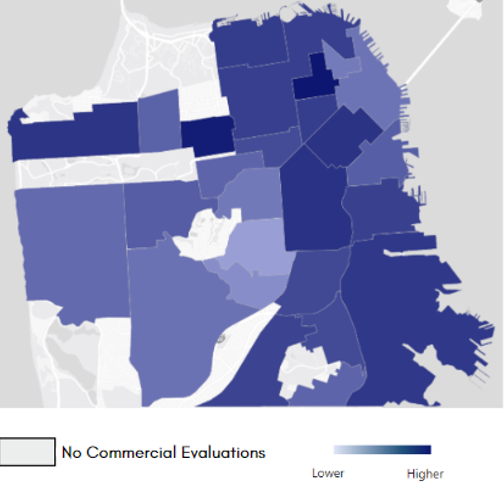
Neighborhood level analysis for Key Commercial Areas
The map below shows neighborhood-level results for broken glass, with darker shades of purple representing higher occurrences.
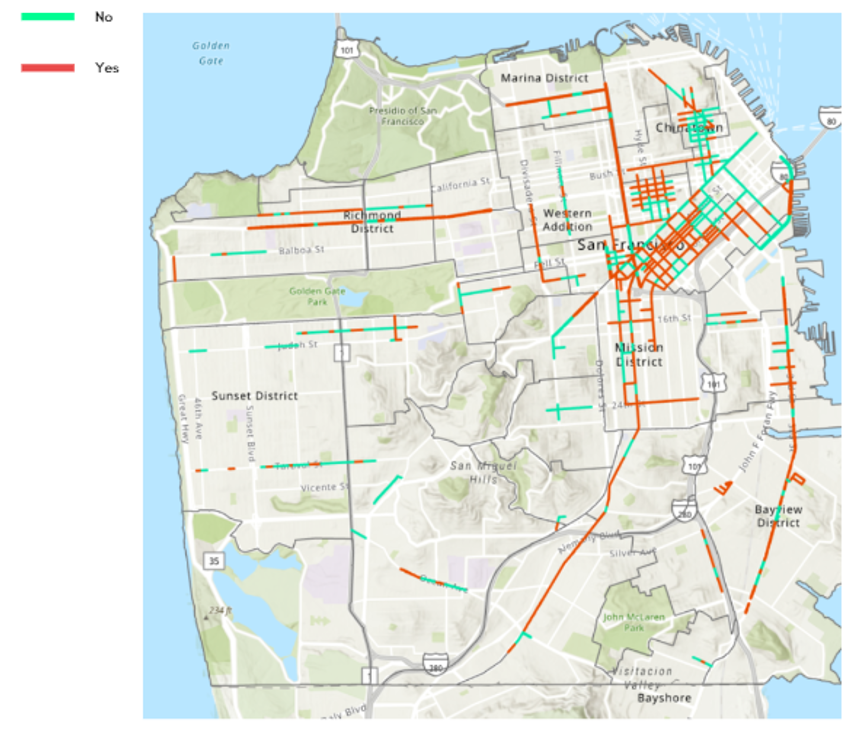
The map below shows the street segments where broken glass was observed.
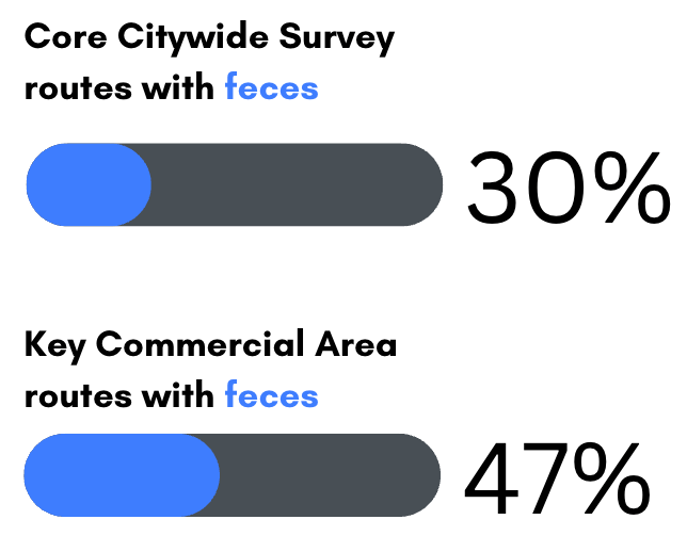
About 30% of evaluated streets and sidewalks report feces
Observations of human and animal feces were less common in the Core Citywide sample, with about 30% of evaluations observing feces on the street or sidewalk. In contrast, almost half (47%) of evaluations in all Key Commercial Areas observed feces.
Neighborhood level analysis for Key Commercial Areas
The map below shows neighborhood-level results for feces, with darker shades of purple representing higher occurrences.
The map below shows the street segments where feces was observed.
Other hazards
Other hazards, such as dead animals, syringes, condoms, and odors were rarely observed. When reported, these hazards were concentrated in the Mission, Tenderloin, and South of Market, with fewer issues on other areas of the City.
Back to top
Results Overview
| Feature |
Core Citywide Survey (% issue present) |
Key Commercial Areas (% issue present) |
| Street litter | 41% moderate to severe | 64% moderate to severe |
| Sidewalk litter | 44% moderate to severe | 67% moderate to severe |
|
Overflowing trash receptacles |
8% | 11% |
| Sidewalk clearance | 31% | 12% |
|
Sidewalk pavement defects |
75% moderate to severe | 75% moderate to severe |
| Illegal dumping | 36% | 49% |
| Broken glass | 47% | 58% |
| Feces | 30% | 47% |
| Syringes | 1% | 3% |
| Condoms | 0.1% | 0.5% |
| Dead animals | 5% | 0.5% |
| Odors | 2% | 3% |
| Graffiti | 20% moderate to severe | 71% moderate to severe |
| Transit shelters | 83% | 91% |
This is the first year the Controller’s Office evaluated streets and sidewalks using the new Evaluation Standards. Based on CY22 findings, the Controller’s Office plans to focus on refining the evaluation methodology in the 2023 survey.
This collaborative process with SF Public Works will drive deeper analytical work that aims to support operational decisions. Year-over-year results will be annually reported to track the trend in cleanliness over time. The three major areas of further research below describe future endeavors that the Controller’s Office will facilitate in partnership with Public Works stakeholders:
1. Refine Standards & Sampling Methodology
- In collaboration with SF Public Works stakeholders, the Controller’s Office will refine survey standard feature definitions and sampling methodology.
2. Performance Standard Process
- The Controller’s Office will use these pilot-year findings as a baseline to inform a future performance standard setting process with relevant stakeholders, including the SF Sanitation and Streets Commission.
3. Working Paper Series & Qualitative Research
- The findings from the CY22 survey provide a rich source of data for several potential areas of research. The Controller’s Office plans to report on additional special topics that build on the findings in this report and support SF Public Works decision making.
Back to top
Who is responsible?
Generally, San Francisco Public Works (SFDPW) and other City agencies maintain public streets and City property on or along the sidewalk. Private property owners are responsible for removing graffiti from their buildings and keeping sidewalks and curbs in front of their property clean and maintained. Local, state, and federal agencies, as well as private utilities, are responsible for other features like power lines, highways, regional transit shelters, and schools. In some areas, property owners and merchants form community benefits districts to fund sidewalk maintenance and cleaning operations.
Back to top
Find out more
Visit the Streets and Sidewalks Program homepage to see information on past years.
View the full dataset here.
Back to top