Key findings from the interim report
This report highlights results and trends from 2022 and two 6-month time periods in calendar year 2023 – January-June 2023 and July-December 2023. This memo is not a comprehensive report and focuses on trends in a small number of high-salience areas through the first half of Fiscal Year 2024 (FY24).

Background
San Francisco’s Charter requires the Controller’s Office (CON) to work with San Francisco Public Works (Public Works) to develop and implement street and sidewalk maintenance standards and report out on the City’s condition under the standards. CON’s City Performance group manages the collection of cleanliness data from evaluations of a representative sample of San Francisco’s streets and sidewalks. These evaluations collect data on a number of characteristics, including: street litter, sidewalk litter, larger dumped items, graffiti, feces (we don't differentiate between human or canine), and several other markers of cleanliness or street conditions. The 2022 Maintenance Standards provide detailed descriptions of these features.
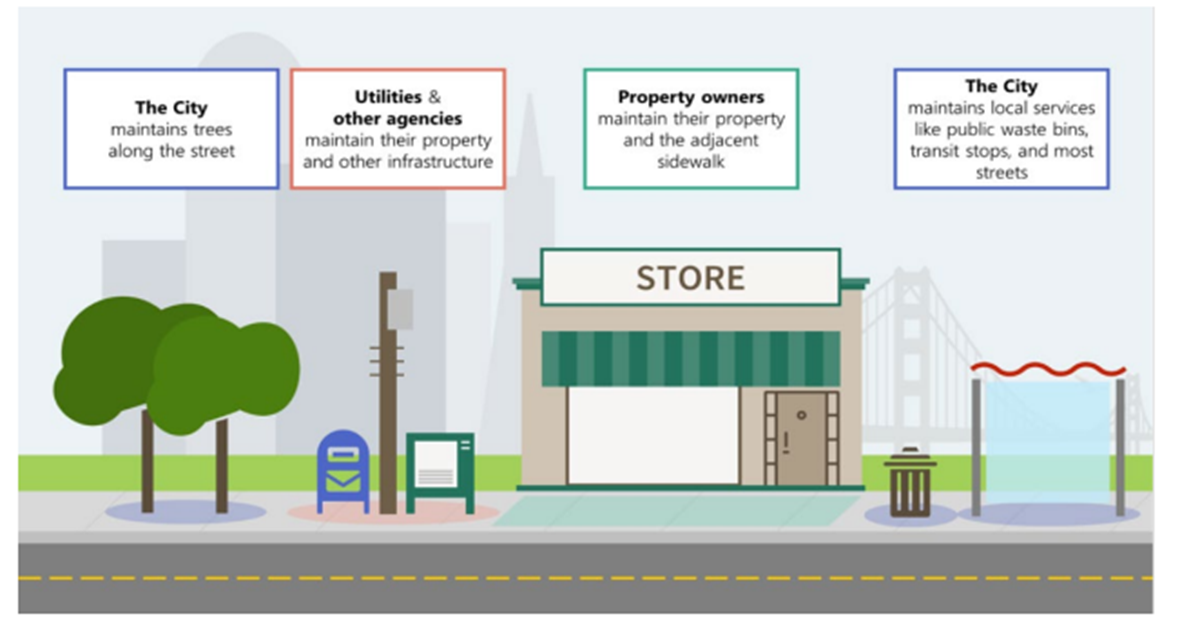
Generally, Public Works (SFPW) and other City agencies maintain public streets and City property on or along the sidewalk while private property owners are responsible for keeping sidewalks and curbs in front of their property clean and maintained. For more detail on maintenance responsibilities, see Appendix D of the 2022 Annual Report.
Back to top
Data Collection and Sampling
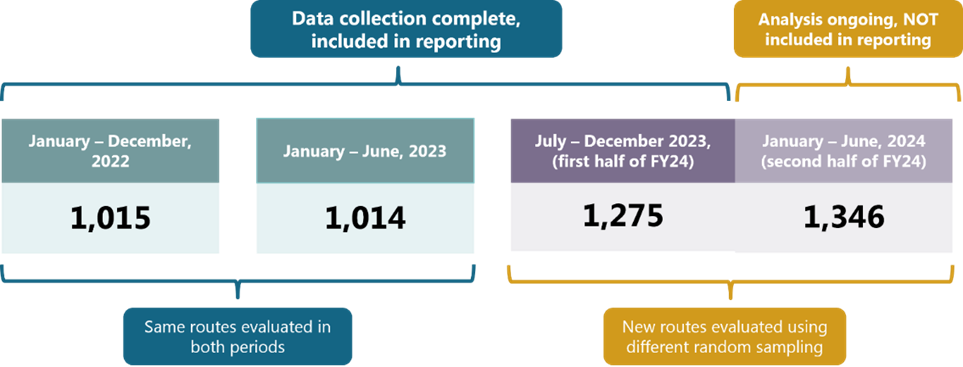
Following the calendar year 2022 results for street and sidewalk standards that City Performance reported on in May 2023, this report highlights results and trends from 2022 and two 6-month time periods in calendar year 2023 – January-June 2023 and July-December 2023. This memo is not a comprehensive report and focuses on trends in a small number of high-salience areas through the first half of Fiscal Year 2024 (FY24). A more comprehensive report will be available in Fall 2024 and will include an additional six months of data collection between January and June 2024.
In July 2023, the sampling methodology and routes evaluated changed to improve our ability to report at a neighborhood level. We have checked the validity of results wherever possible to confirm trends over time are not driven by the change in sampled routes. For more detail, see the Data and Methodology section at the end.
Back to top
Citywide Litter Trends
Back to topLitter levels decreased during 2023
We measure litter on routes on a five-point scale ranging from 1 (“None”) to 5 (“Widespread litter with significant accumulation”).
| Litter Score | Litter Description |
|---|---|
| 1 | None - the sidewalk is free of litter |
| 2 | A few traces - the sidewalk is predominantly free of litter except for a few small traces |
| 3 | More than a few traces but no accumulation - there are no piles of litter, and there are large gaps between pieces of litter |
| 4 | Distributed litter with some accumulation - there may either be large gaps between piles of litter or small gaps between pieces of litter |
| 5 | Widespread litter with significant accumulation |
- Sidewalk litter averaged between 2 (“A few traces”) and 3 (“More than a few traces but no accumulation”) throughout calendar years 2022 and 2023.
- Sidewalk litter rose over the course of 2022 and early 2023 before decreasing.
- In the last six months of data collection between July and December of 2023, sidewalk litter averaged 2.42, lower than the 2.75 average in the prior six months.

Average sidewalk litter scores, 2022 - 2023
We also measure litter on streets in the same format as sidewalk litter. Throughout 2022 and 2023, street litter followed similar patterns to sidewalk litter. Levels of street litter are slightly lower which makes sense given pedestrians spend more time on sidewalks, and street litter is likely either dropped out of vehicles or blown in from other areas. While the change in sampled routes for the third period of data collection could cause changes in observed litter, we controlled for route locations and believe the shift is not driving these lower litter scores.
Back to topImprovements in the two middle litter ratings drove the decrease in average levels
- Much of the improvement in average sidewalk litter between January to June 2023 and July to December 2023 came from fewer routes rated “More than a few traces” (Litter level = 3) and more routes rated “A few traces” (Litter level = 2).
- There was also a decrease in routes with the second-highest level of litter “Some accumulation” (Litter level = 4) during the last six months of data collection.
- Less than five percent of evaluated routes had either no litter or significant accumulations of litter in any period.
Sidewalks with either very significant litter or zero litter might be very high salience for a resident, but they may encounter them on relatively few blocks. Instead, improvements in litter in the final six months of calendar year 2023 were in the middle, something that may be less immediately obvious to a pedestrian. The graphic below shows the distribution of sidewalk litter and how it changed over the three data collection periods in 2022 and 2023.

There were large decreases in Moderate to Severe litter
City Performance previously reported results from a single year of observations with a focus on simple summary metrics. We reported on the data collected in calendar year 2022 by categorizing results into litter levels of “None to Minor” (the lowest two levels of litter observed) and “Moderate to Severe” (the top three levels of litter observed) and reported the percent of routes in each category.
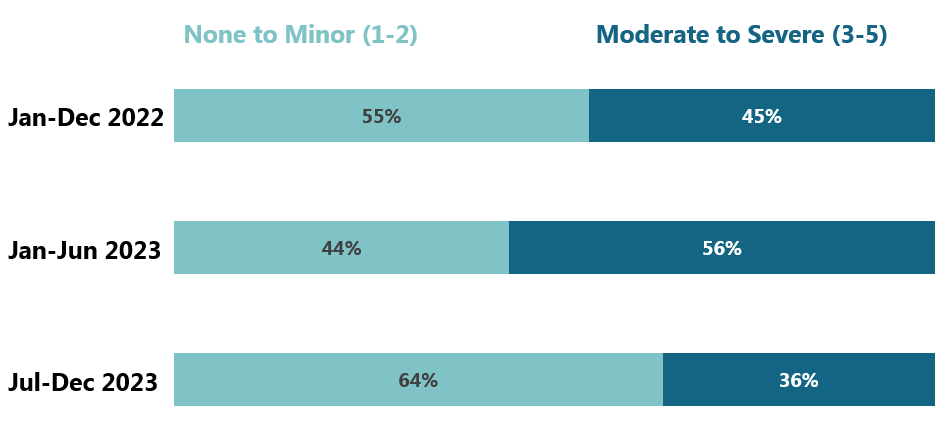
- Between calendar year 2022 and January to June 2023, Moderate to Severe litter increased by 11 percentage points before decreasing 20 percentage points in the final six months.
- Trends measured this way show the same direction as average levels of litter, but look more dramatic because of how the results are distributed and where we defined the line between Minor and Moderate litter.
Other Trends Over Time
Back to topGraffiti levels fluctuated within periods but are stable over time
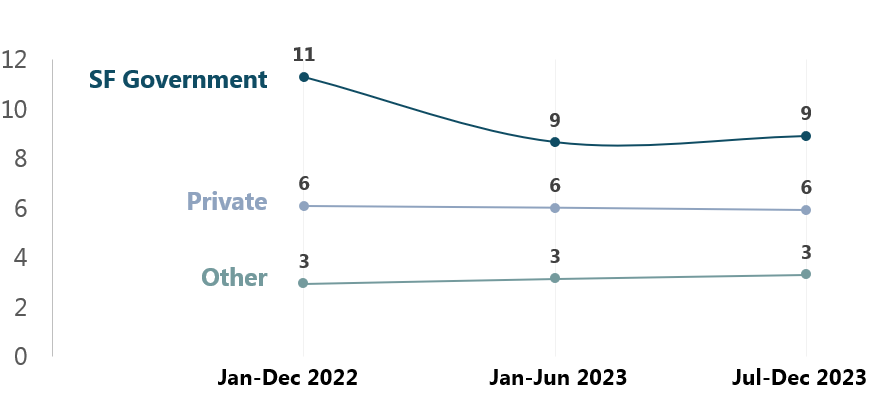
Graffiti includes text, symbols, and images marked on buildings, sidewalks, street pavement, trees, and other areas visible to the public. Between January and December of 2022, we observed on average 20 instances of graffiti on evaluated routes across the city. Over the next two periods the averages were 18. Median graffiti counts—which are often more stable than averages—in the same periods were seven, five, and eight, respectively. Overall, these are quite steady rates. The levels fluctuate over smaller time periods but don’t follow a particular trend.
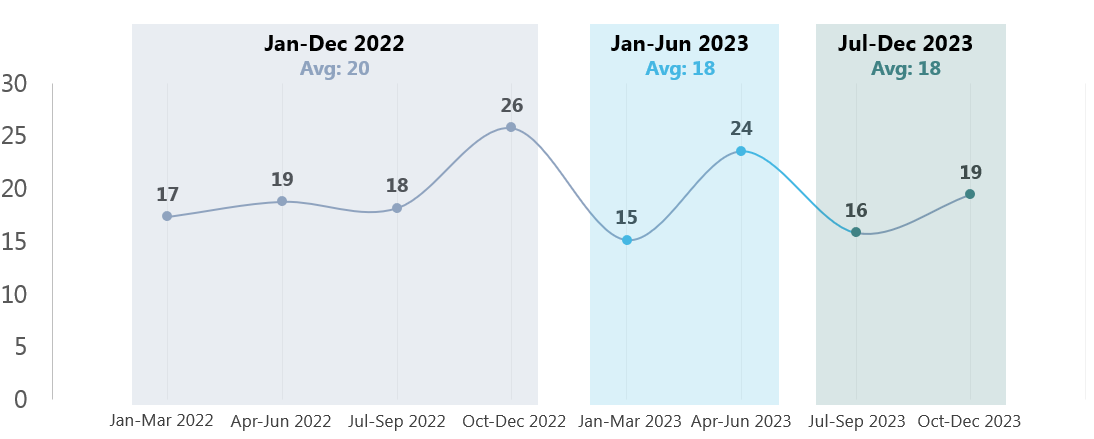
In general, the City is responsible for removing graffiti from City property; residents, business owners or building owners are responsible for graffiti on their properties, and other entities (such as BART or PG&E) are responsible for maintaining their properties. We collect information that separates these three types of graffiti to the extent possible. There was a small decrease in average instances of graffiti observed on city property between 2022 and 2023.
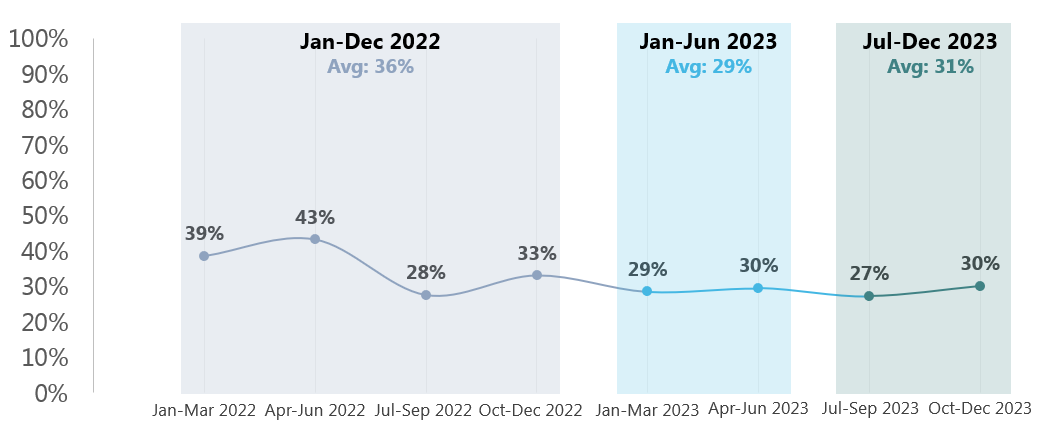
Evaluators also capture the presence of graffiti containing offensive language on a route. The proportion of routes with offensive graffiti is quite low but increased in the second half of the 2023 calendar year. Routes with offensive graffiti were two percent and one percent in 2022 and the first half of calendar year 2023, respectively, but increased to six percent between July and December of 2023. The rate was highest between July and September of that year.
Back to topDumping levels decreased slightly in 2022 and have remained stable
Evaluators count the number of large, dumped items on every route. Citywide, dumping has remained relatively stable over the data collection period, with some evidence of a decrease between the first and second year of data collection.
Feces levels increased in the second half of 2023
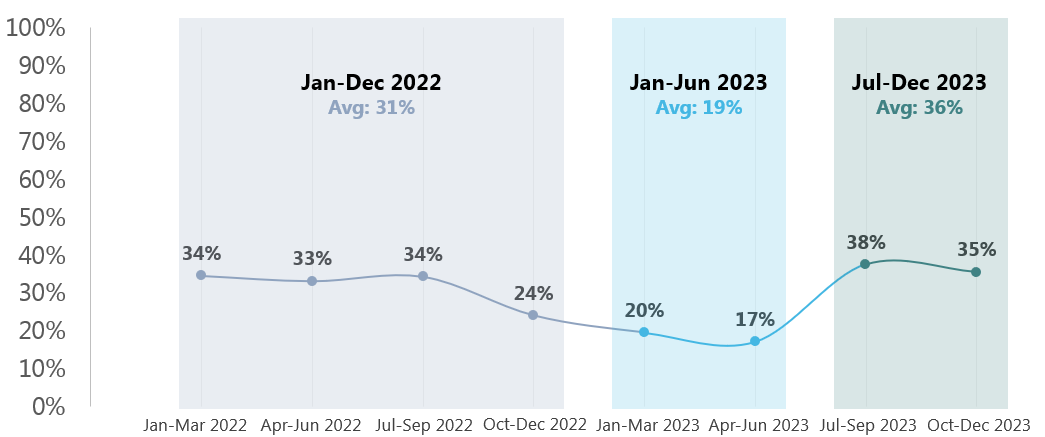
We observed a significant decrease in feces from calendar year 2022 to the first half of calendar year 2023, but levels increased above those from 2022 in the second half of calendar year 2023. This was true both for the presence of any feces and in looking at average levels. Looking at quarterly data we see a long, slow decrease over the first year and a half of data collection followed by an increase in the two most recent quarters. We will continue to examine these trends and whether they continue as we collect more data and have more ability to identify if there are changes in any particular areas or types of routes that may be driving these trends.
Sidewalk clearance issues decreased rapidly in the second half of 2023
Evaluators capture when sidewalk clearance is obstructed by temporary objects like a fallen tree branch or an improperly parked scooter, along with permanent objects such as utility boxes. This is important to capture because obstructions to the sidewalk can impede safe passage for pedestrians and people with disabilities.
Observed issues with sidewalk clearance increased steadily over the 18 months between January 2022 and July 2023 before they dropped sharply between July and December 2023. The proportion of routes with sidewalk clearance issues dropped by 34 percentage points between the first and second half of 2023.
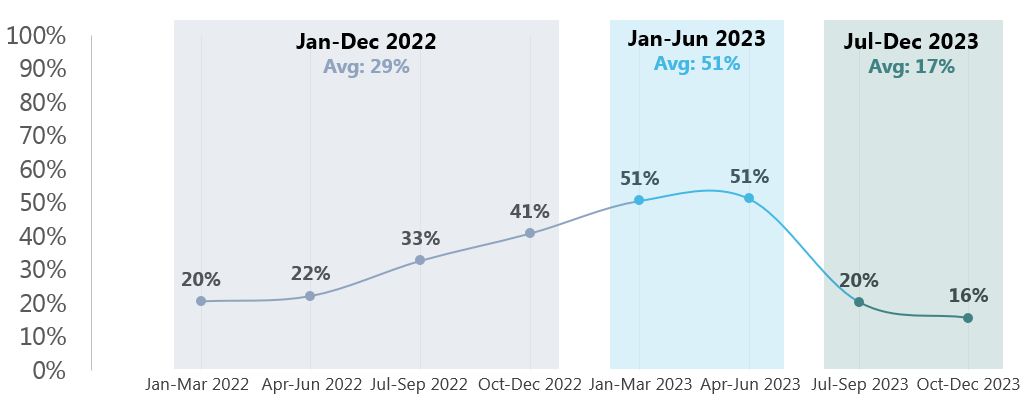
These changes do not appear to be caused by seasonality. Since sidewalk clearance issues may be caused by items like downed branches or trees, we might expect clearance issues to be cyclical over a year, but we saw a steady increase for a year and a half, and then a sharp drop. We did observe the highest levels of clearance issues during the winter and spring of 2023 which were marked by a series of severe winter storms with heavy rainfall and strong winds. Over that period, 21 percent of issues were identified as some type of tree, shrub, or other greenery, more than twice as high as during other times.
Back to top
What's next
City Performance is continuing additional data collection. We will publish a more comprehensive annual report with data through June 2024 and will continue to detail trends we have explored in this publication. This report will refine the most appropriate and meaningful measures to help San Franciscans understand the full scope of the cleanliness and condition of the streets and sidewalks in their city.
Back to top
Data and Methodology
The evaluation team sampled 3,000+ street and sidewalk segments by reviewing 14 specific features to assess the cleanliness and conditions of the City’s streets and sidewalks. The 2022 Maintenance Standards provide detailed descriptions of these features.
Selected routes include both residential and commercial areas. We sampled to match the makeup of the City’s residential and commercial and mixed-use streets.
Sampling in 2022
In Calendar Year 2022 we evaluated approximately 1,000 randomly selected street segments that represented all the streets and sidewalks across the City and County of San Francisco. These street segments were evaluated once over the course of the year. Between January and June of 2023, these same street segments were evaluated a second time, making up the second period of data in this report.
For additional details, see Appendix B of the 2022 Annual Report.
Sampling Change in July 2023
Starting in July 2023, we modified the sampling methodology slightly and randomly selected a new set of routes across the city. This means that for the purposes of this report, the two most recent 6-month time periods (January-June 2023 and July-December 2023) cannot be combined and analyzed together as a full calendar year due to their different route samples. Data collection for January-June 2024 is not included in this report as it is still being analyzed, but will be reported out in a larger annual report covering the full Fiscal Year 2024.
The citywide representative sample includes over 2,500 randomly selected street segments, approximately 1,300 of which have been evaluated and are included in this report. The representative sample is selected to prioritize significance in reporting by neighborhood and within route type – residential or commercial.
Getting to a reliable result at the neighborhood level requires oversampling in small neighborhoods. For this reason, we do not report a straight average or percentage at a citywide or neighborhood level, but report results with weights instead. Applying weights to averages helps ensure that changes we see in the data are not driven by the oversampling of smaller neighborhoods. We do not weight earlier periods because the sampling methodology used does not oversample in the same way.
Changing the sampling methodology and therefore the majority of specific routes selected could introduce random variation in our results. We verified that the approximately 10% of routes that were evaluated in all three periods generally followed the same trends as the full samples. This suggests that changes we see are unlikely to be caused by the change in routes.
Back to top
Find out more
Visit the Streets and Sidewalks Program homepage to see information on past years.
Back to top